
Skip to the main content.
Original Research · The State of Messaging 2026

Business texting statistics for 2026: Data from 16,000+ organizations

We measured and analyzed what more than 16,000 organizations sent through Text-Em-All between August 2025 and July 2026. In this analysis, we look at the trends around reply speed, seasonal peaks, message size, and more.

By Text-Em-All. Last updated November 20, 2026.
An illustration of two people waving from text message bubbles in front of bar and line charts, introducing a report on business messaging statistics.

What stands out in business messaging in 2026

  1. Text is growing. Texts make up 75% of messages in 2026, up from 68% in 2022.

  2. Texts are going to fewer people. The average mass text went from 236 recipients in 2022 to 166 in 2026, a 30% drop.

  3. Replies come fast. 50% of all replies to a business text arrive within 18 minutes, and 98% arrive within a day.

  4. Opt-outs are falling. 16% of texts sent to 100 or more people got an opt-out in 2026, down from 26% in 2022.

  5. Job openings get the most opt-outs. 54% of job-opening texts sent to 100 or more people got at least one opt-out, more than any other kind of text.

  6. Promotions get more opt-outs. Promotional texts get about 3.5 times as many opt-outs per person texted as informational ones.

  7. Calls still deliver. 86% of automated phone calls are delivered. Of all calls, 49% reach an answering machine and 37% reach a person.

  8. One storm. In the busiest week of the year, organizations sent 11 times as many emergency and closure alerts as in a normal week.

  9. Seasons are specific. In September, organizations send 4 times as many medical texts as in a typical month, and in October they send 2 times as many HR and benefits texts.

  10. Holidays don't slow messaging. Across all messages, Christmas week ran 7% above a normal week, and most holiday weeks ran within about 10% of normal.

01 Texts and calls

Texts grew from 68% to 75% of messages in the last 4 years

In 2022, 68% of the messages organizations sent were texts. In 2026, texts make up 75%. Three out of every four messages are now a text, and calls make up the rest.

Even though most messages are now texts, some industries still send a lot of calls. Here are the five industries where calls make up the biggest share of what they send:

  1. Clubs and associations: 52% calls
  2. Christian organizations: 43% calls
  3. Legal services: 40% calls
  4. Waste and recycling: 36% calls
  5. Utilities: 35% calls

Why still call? A call reaches people a text can't, like members who don't text or who'd rather hear a voice, and it's hard to miss when the news is urgent, like a service outage or a pickup change.
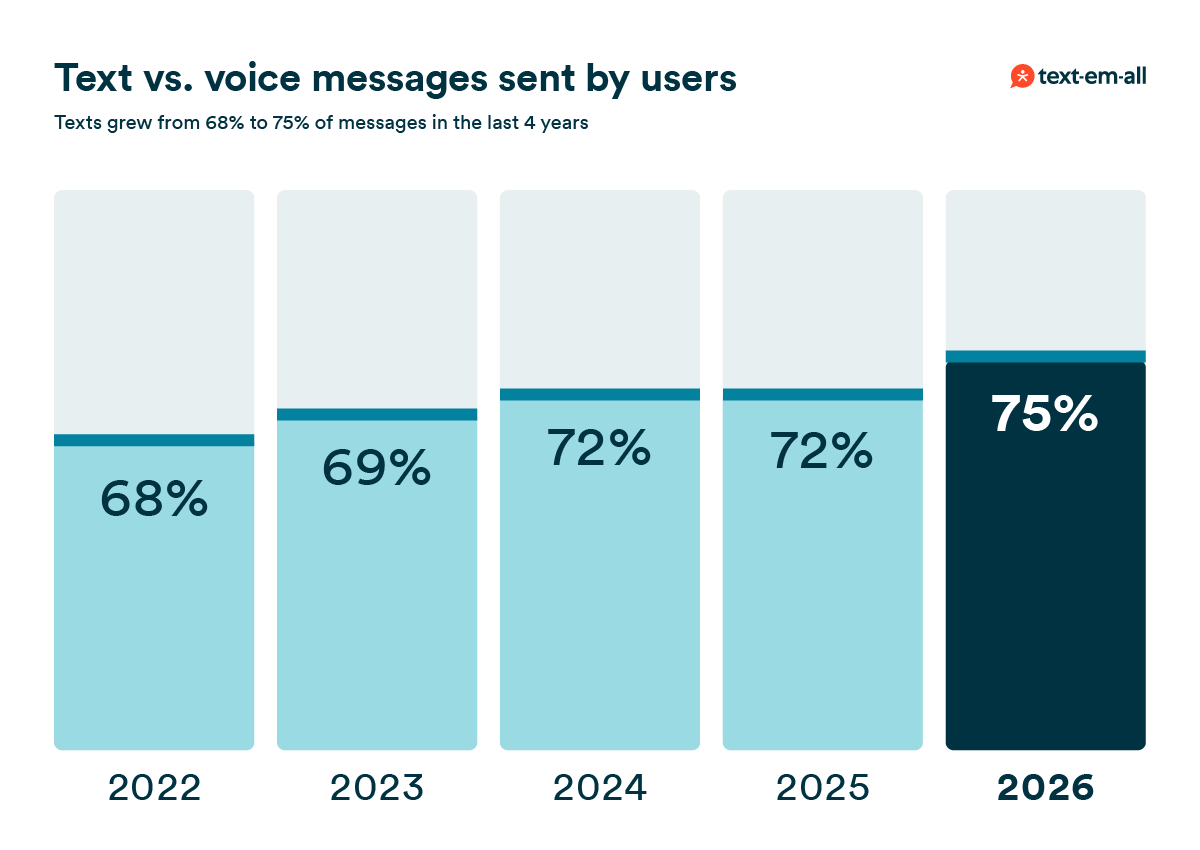
A Text-Em-All bar chart of text versus voice messages sent by users, showing texts growing from 68% of messages in 2022 to 69% in 2023, 72% in 2024 and 2025, and 75% in 2026.
02 Message size

The average mass text is 30% smaller than four years ago

The average mass text went from 236 recipients in 2022 to 166 in 2026, a 30% drop.

Sends to 1,000 or more people got rarer too, falling by more than half. In 2026, 2% of mass texts go to 1,000 or more people. In 2022, 4% did.

One likely reason is that sending to everyone on your list is easy to do and easy to regret. Senders seem to be grouping contacts by who needs the message, which is what both carriers and recipients prefer. If most of your sends still go to your whole list, try cleaning your list or grouping your contacts into sub-categories and compare the replies and opt-outs.

Smaller sends get fewer opt-outs

Splitting a big list into smaller groups isn't just tidier, it also lines up with fewer people opting out. Texts to 100 or more people are about 4 times as likely to get an opt-out as texts to under 100 people.
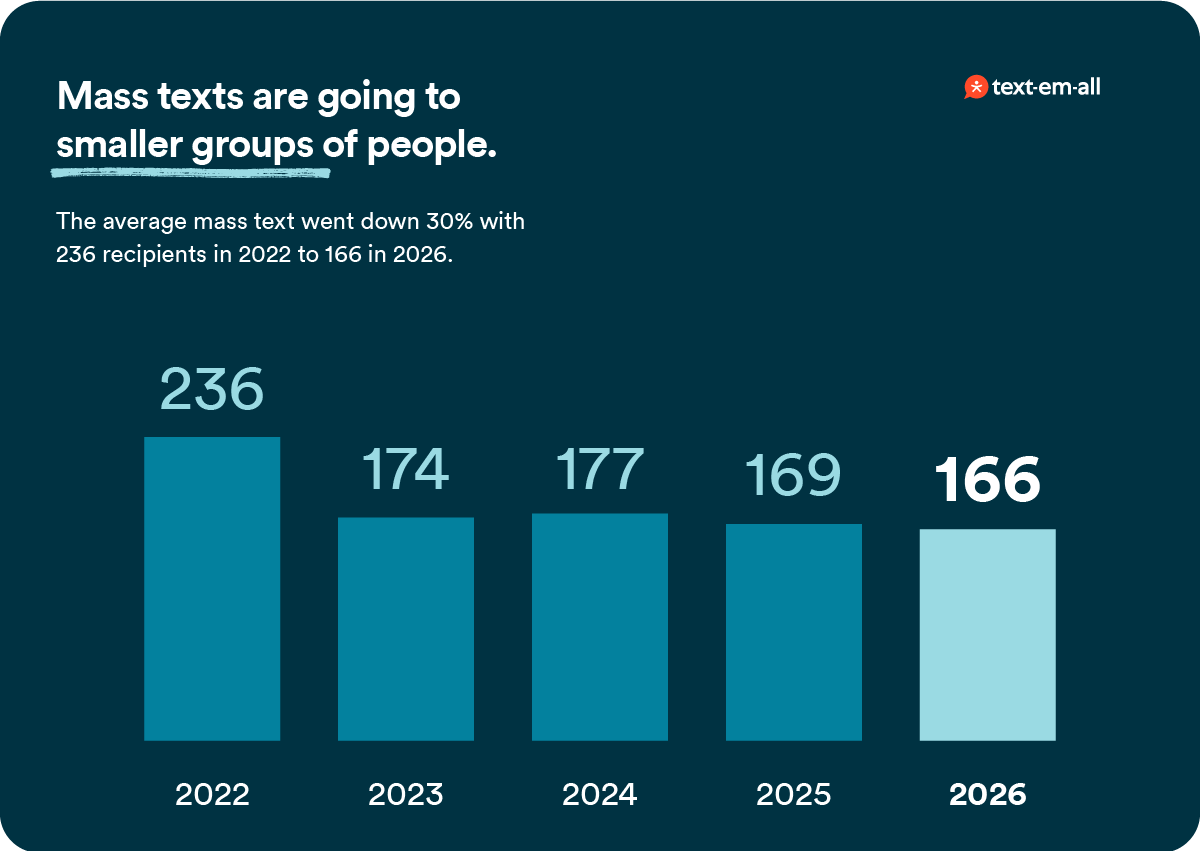
A Text-Em-All bar chart showing that mass texts are going to smaller groups of people, with average recipients per mass text falling 30% from 236 in 2022 to 174 in 2023, 177 in 2024, 169 in 2025, and 166 in 2026.

Average recipients per mass text, years to July.

03 Replies

How fast do people reply to a business text?

Half of all first replies arrive within 18 minutes. People rarely answer instantly and rarely answer after the first day, so a quiet first day is usually a sign that it'll stay quiet.

As for open shifts, we usually see the first "yes" to an open-shift text in about 8 minutes. This makes text an extremely effective outreach method for our staffing firms.

And for all of our customers, about 57% of texts sent to 100 or more people get at least one reply. And for the ones that don't get a reply, most of them don't ask for one, so it's not a failed text.
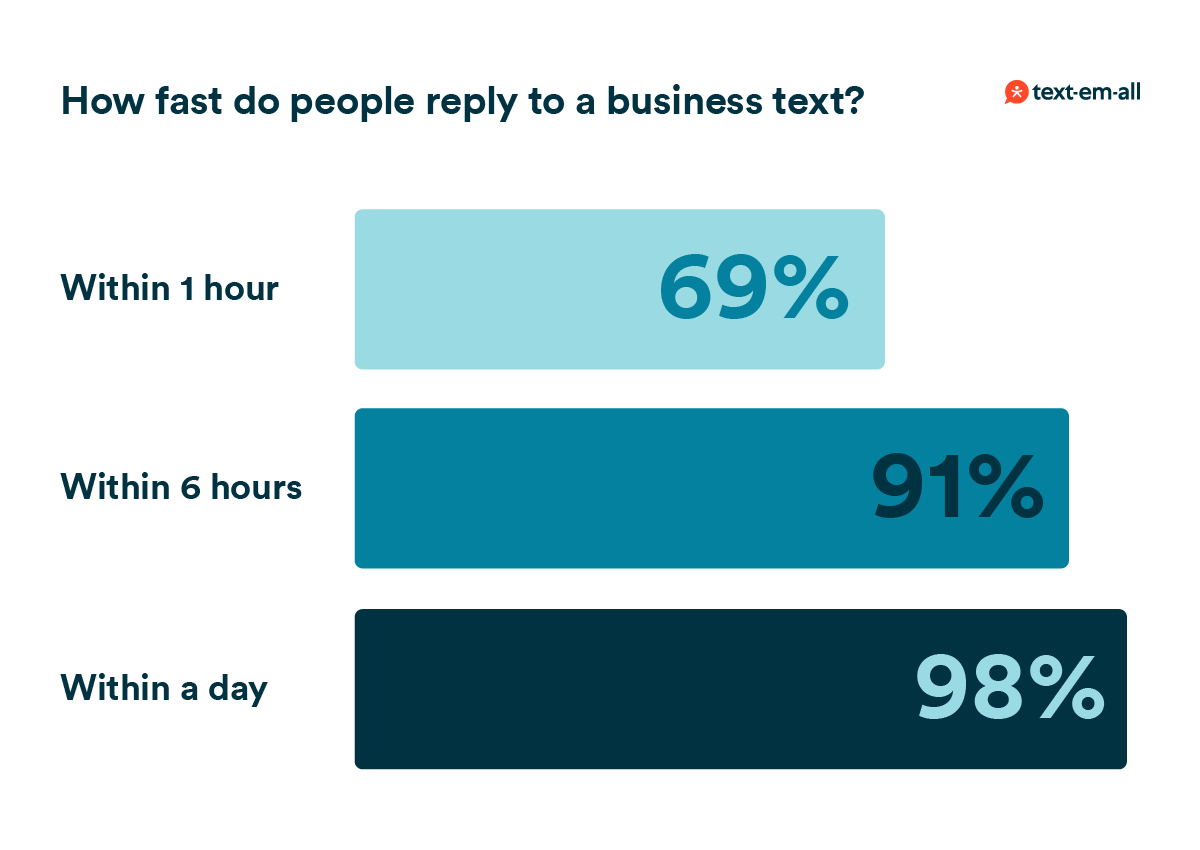
A Text-Em-All bar chart showing how fast people reply to a business text: 69% reply within 1 hour, 91% within 6 hours, and 98% within a day.
04 Opt-outs by year

Fewer texts get opt-outs

In 2022, 26% of texts sent to 100 or more people got at least one opt-out. By 2025 it was 16%, a 10-point drop. While the data can't tell us exactly why, some possibilities include:

  • Carrier registration is now required to send business texts.
  • More senders ask permission first and text less often.
  • Senders are using smaller, more targeted lists.
  • The messages are better, and more of them are ones people want.

For all senders, this is worth watching, because opt-outs are the clearest sign a list is healthy.
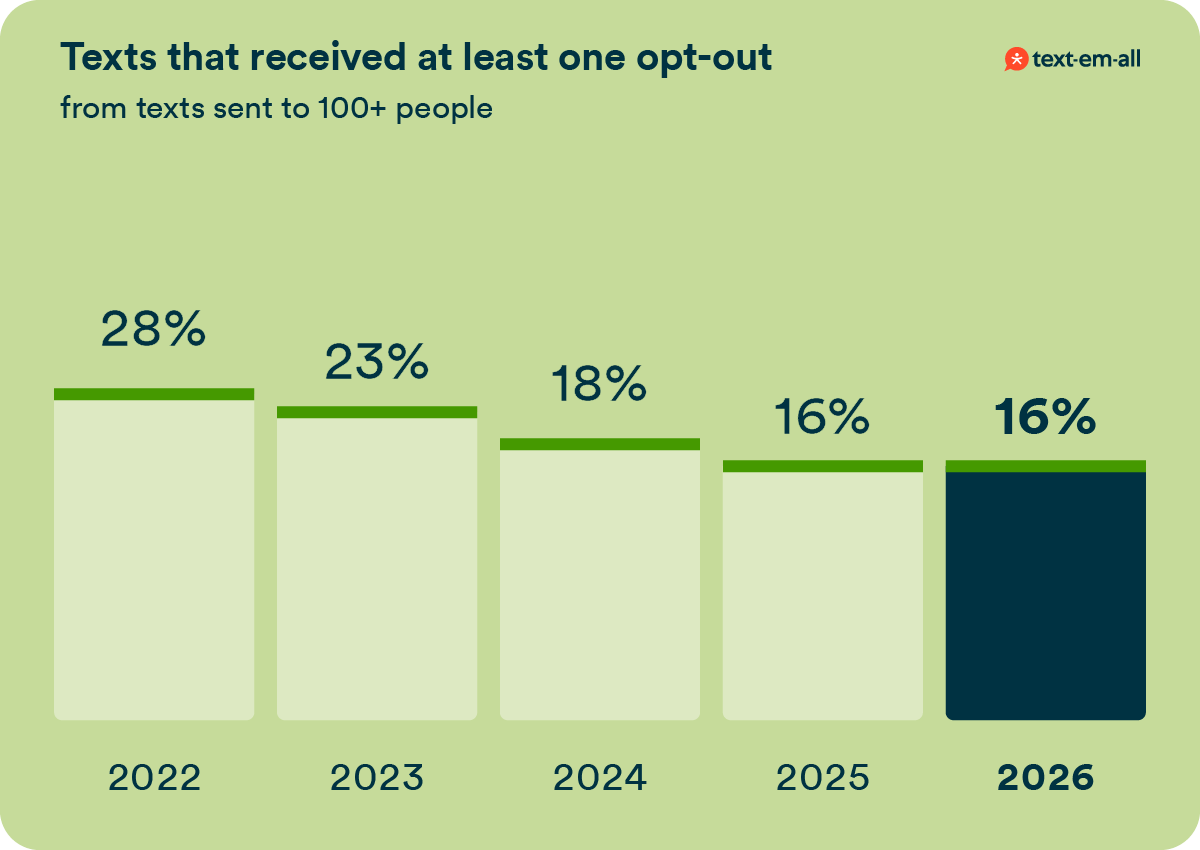
A Text-Em-All bar chart showing the share of texts sent to 100 or more people that received at least one opt-out, falling from 28% in 2022 to 23% in 2023, 18% in 2024, and 16% in both 2025 and 2026.
05 Kinds of texts

Which kinds of texts make people opt out?

Job openings and sales and discounts are the kinds most likely to get an opt-out. More than half of job-opening texts got at least one, but shift offers and reminders almost never do.

The top of this list has something in common: the person often joined for a one time reason and is now continuing to be messaged. Someone who answered one job ad may have gotten the role and not need job openings anymore. In addition, a customer who wanted one coupon may not want a weekly sale. Make sure you clean your lists regularly, and target your messages accordingly.
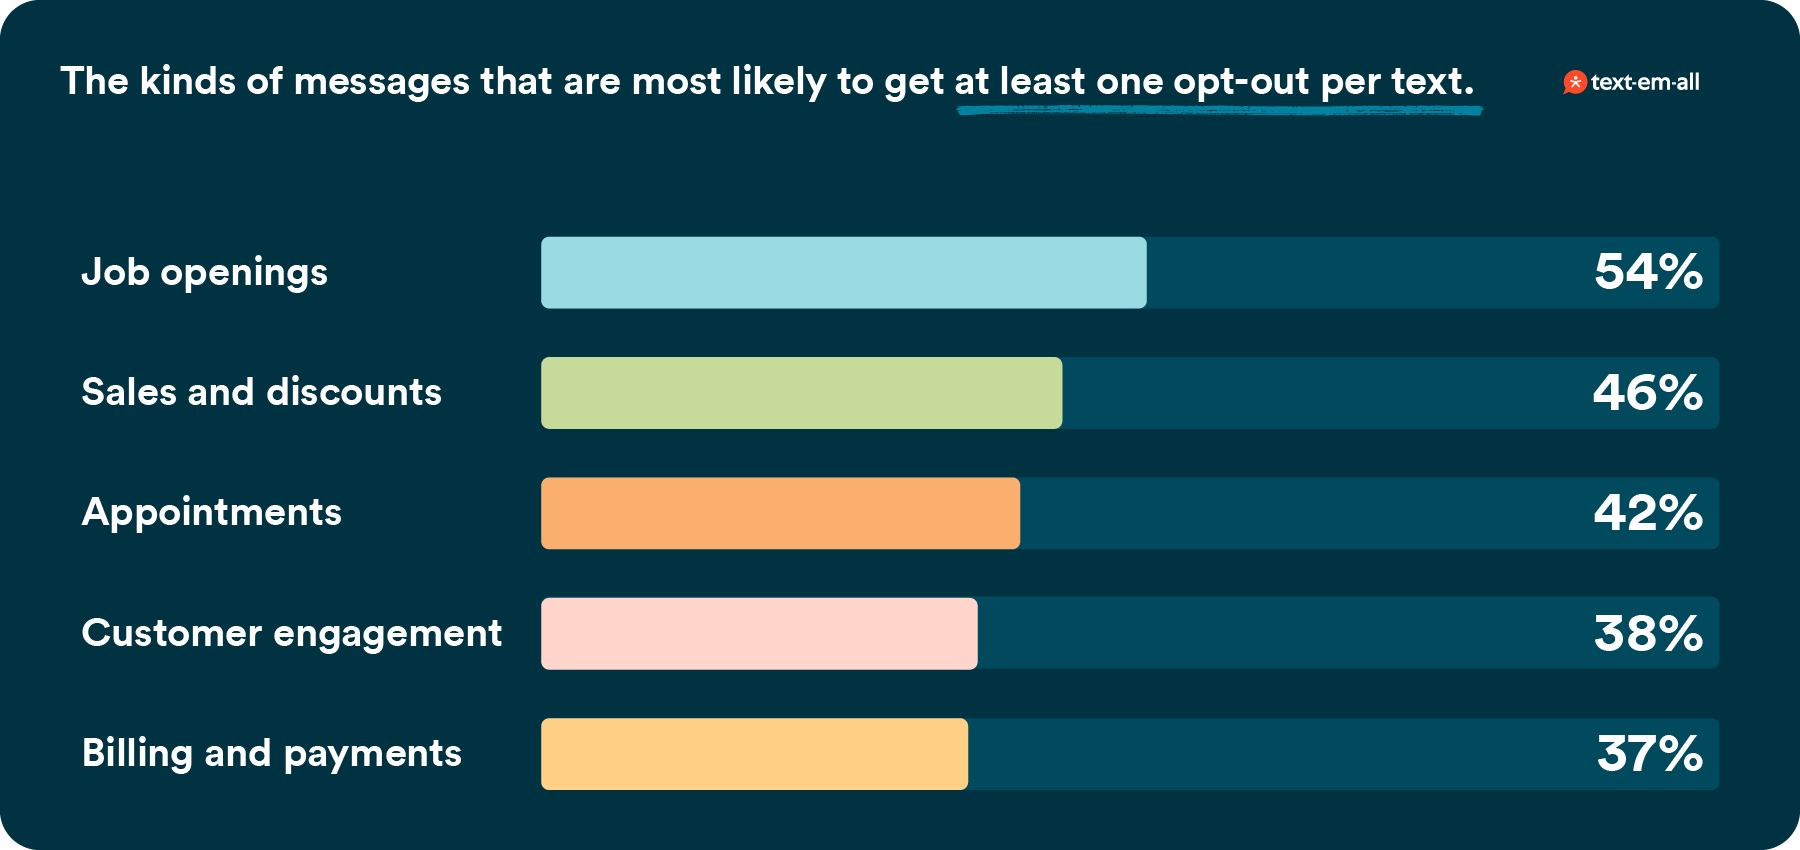
A Text-Em-All bar chart ranking the kinds of messages most likely to get at least one opt-out per text: job openings at 54%, sales and discounts at 46%, appointments at 42%, customer engagement at 38%, and billing and payments at 37%.
06 Promotional texts

Promotional texts get about 3.5 times as many opt-outs

People opt out of sales, offers, ticketed events, and product news more often than they opt out of closure notices or shift alerts. That doesn't make a promotion a bad idea, but it means that you have to put more thought into when you send one.

Only 2 in every 1,000 people who got an informational text opted out, against 7 in every 1,000 for a promotional text. The size of the contact list doesn't affect the ratio.

The difference is an optional text versus a necessary one. A promotion is a text people could take or leave, while a reminder or closure notice is something they actually need. The fix for this is usually fewer, well-thought-out promotions.
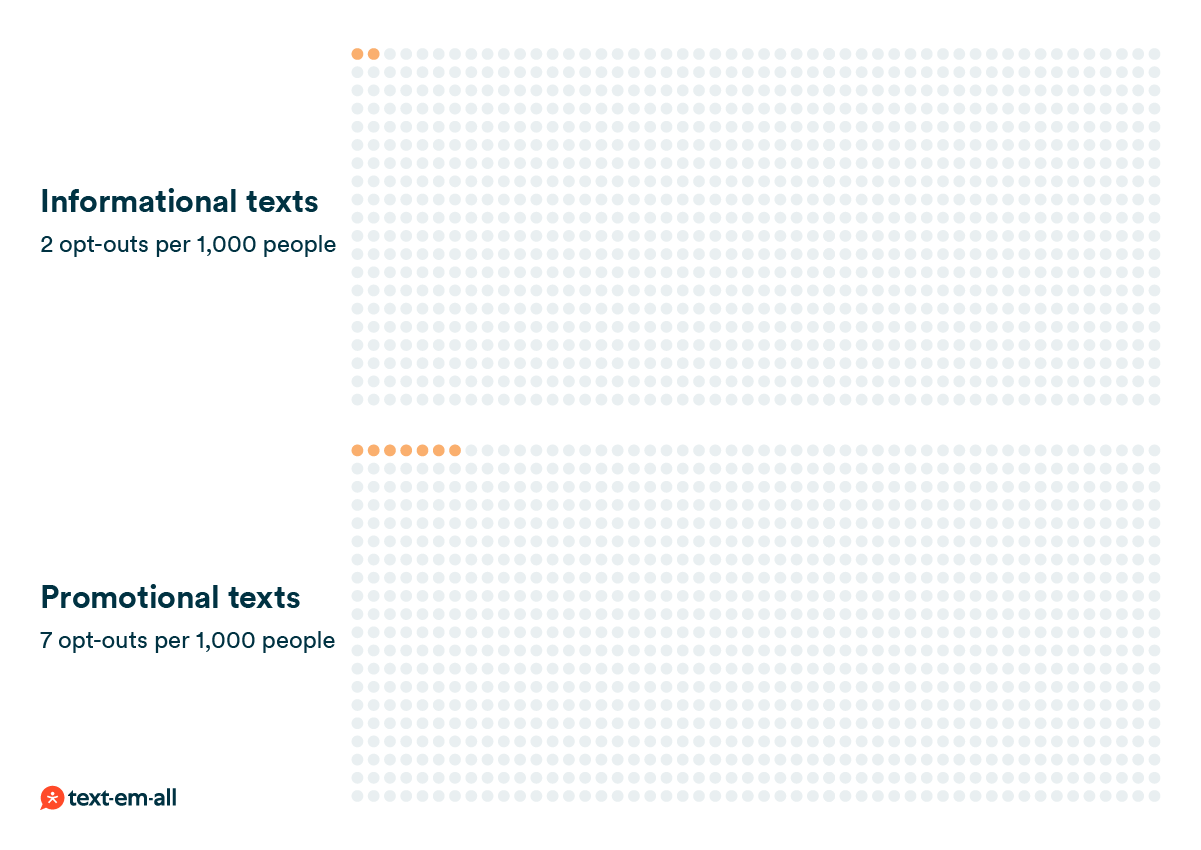
A Text-Em-All dot chart comparing opt-out rates, with informational texts getting 2 opt-outs per 1,000 people and promotional texts getting 7 opt-outs per 1,000 people.
07 Phone calls

Do automated phone calls still reach people?

Yes. 86% of automated calls are delivered. That counts answering machines that played the whole message. While the majority of delivered calls reach an answering machine, voice is still a solid way to reach your contacts.
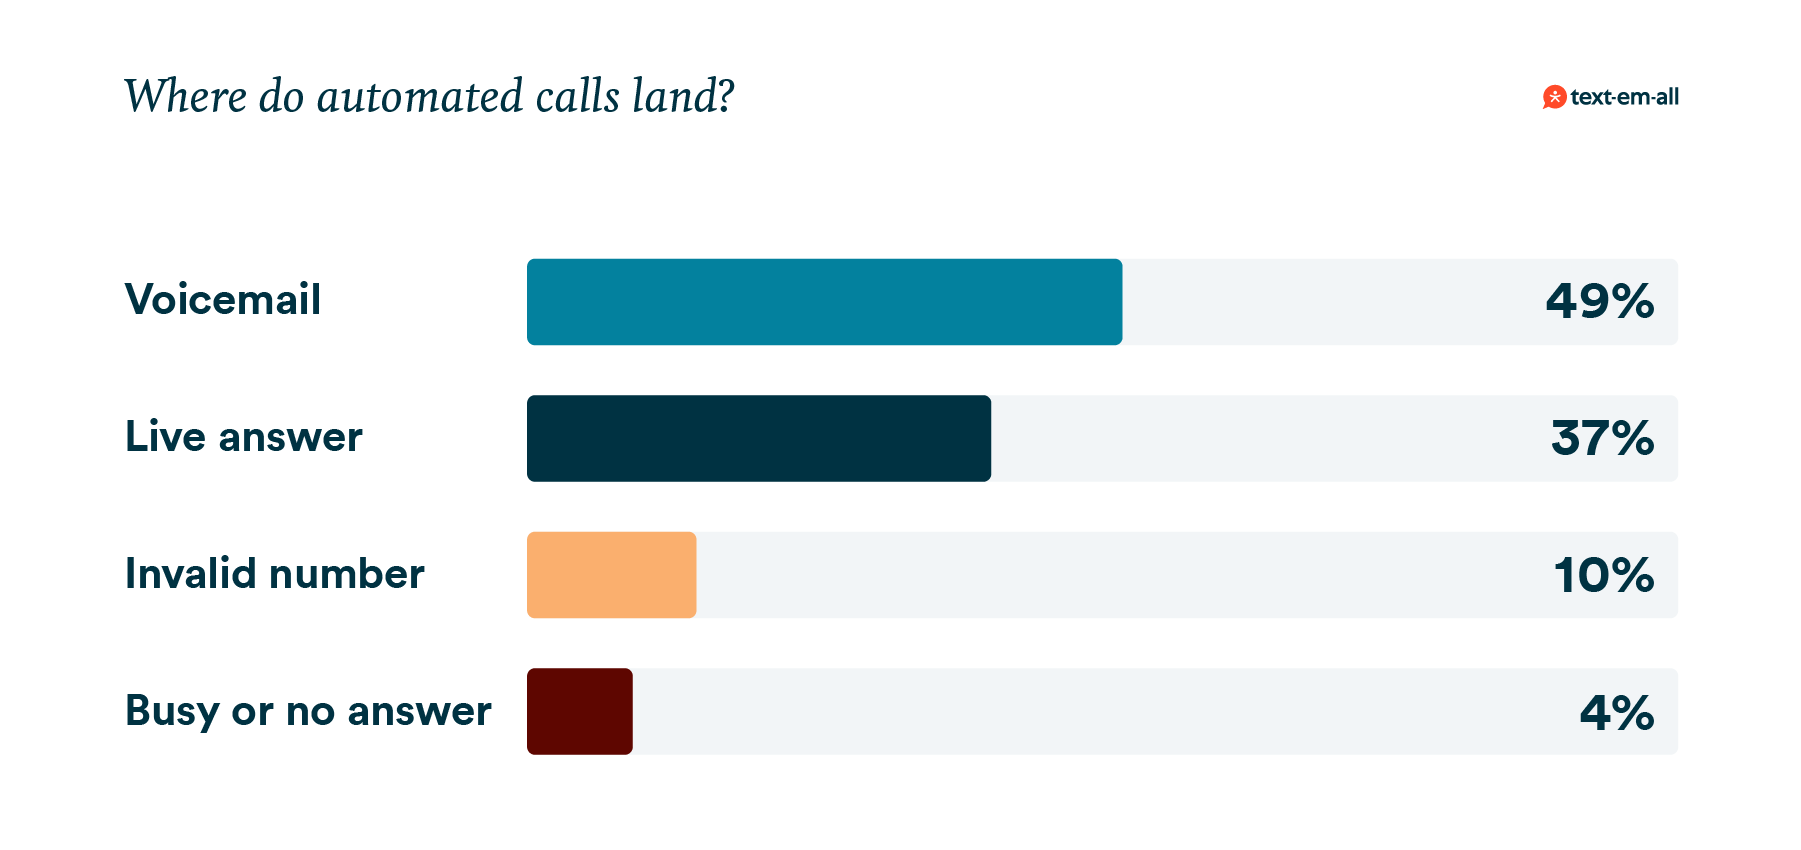
A Text-Em-All bar chart showing where automated calls end up: 49% go to voicemail, 37% are answered live, 10% reach an invalid number, and 4% get a busy signal or no answer.
08 The January storm

A winter storm made one January week the busiest of the year

The busiest week of the year was the week a winter storm hit (January 23 to 27). Organizations sent 11 times as many closure and emergency alerts as in a normal week, and 18 times as many on the peak day, Sunday, January 25.

For marketers and operators alike, the takeaway is to write your closure message before the weather arrives, so all that's left on the day is sending it.

Who sent the most weather messages

Of the messages that mentioned the weather that week in January, 20% came from Christian congregations and 15% from manufacturing. Transportation, property management and senior care each sent 6%.
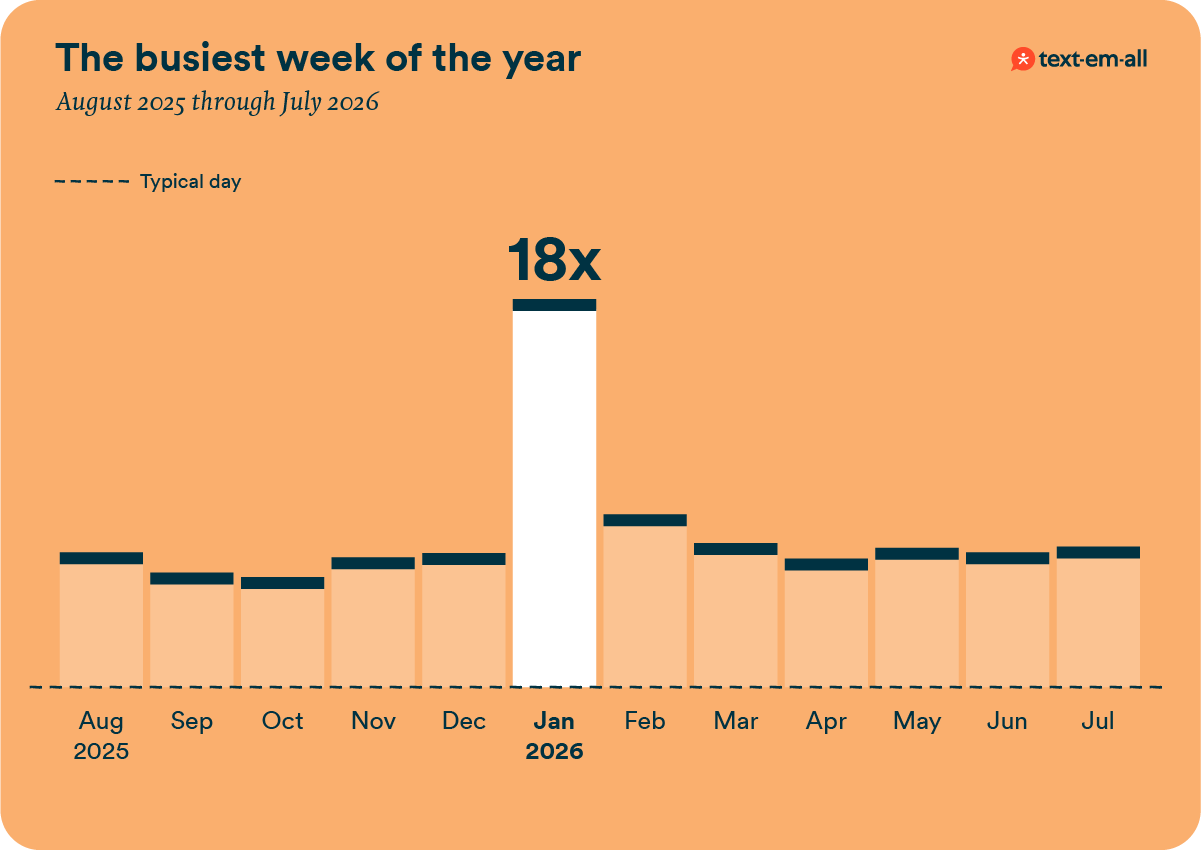
A Text-Em-All bar chart of business messaging volume from August 2025 through July 2026, showing the busiest week of the year in January 2026, when a winter storm drove volume to 18 times that of a typical day.
09 Seasons

Business messaging follows the calendar

Organizations send the most closure notices in January, end-of-year activity messages in May, medical messages in September (many are vaccine and flu shot reminders), and HR and benefits messages in October.
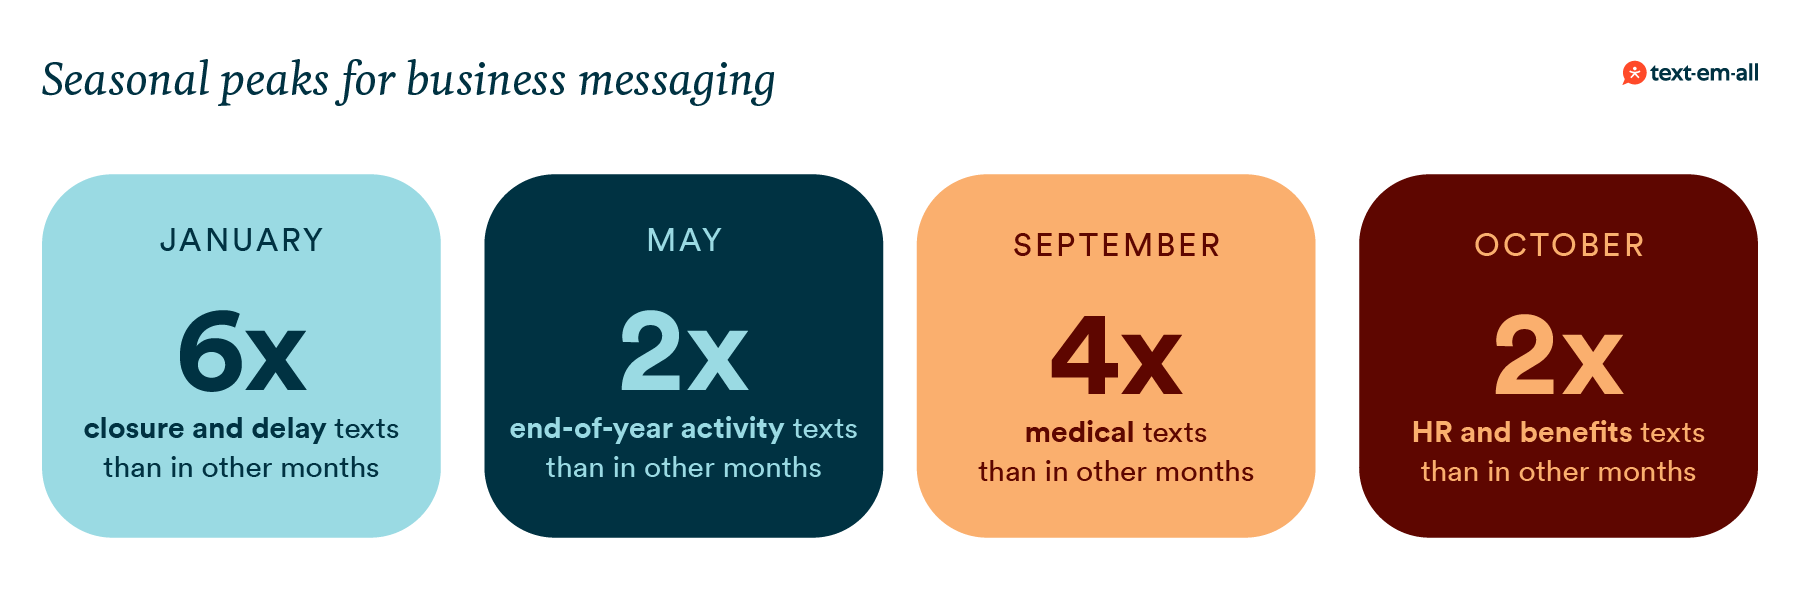
A Text-Em-All infographic showing that business messaging follows the calendar: January has 6 times more closure and delay texts than other months, May has 2 times more end-of-year activity texts, September has 4 times more medical texts, and October has 2 times more HR and benefits texts.
10 Holidays

Holidays don't usually slow business messaging

Messaging stays steady through most holidays, usually within 10% of a normal week. Only the week of July 4 had noticeably fewer messages than usual.

Part of the reason for this is that operational messages don't take days off. Schedule changes, reminders and closures still need to go out, and if other senders pull back, you may have less competition for attention.

If you're planning your holiday messaging, we have guides to help: holiday SMS campaigns, a free campaign calendar template, and seasonal staffing with SMS.
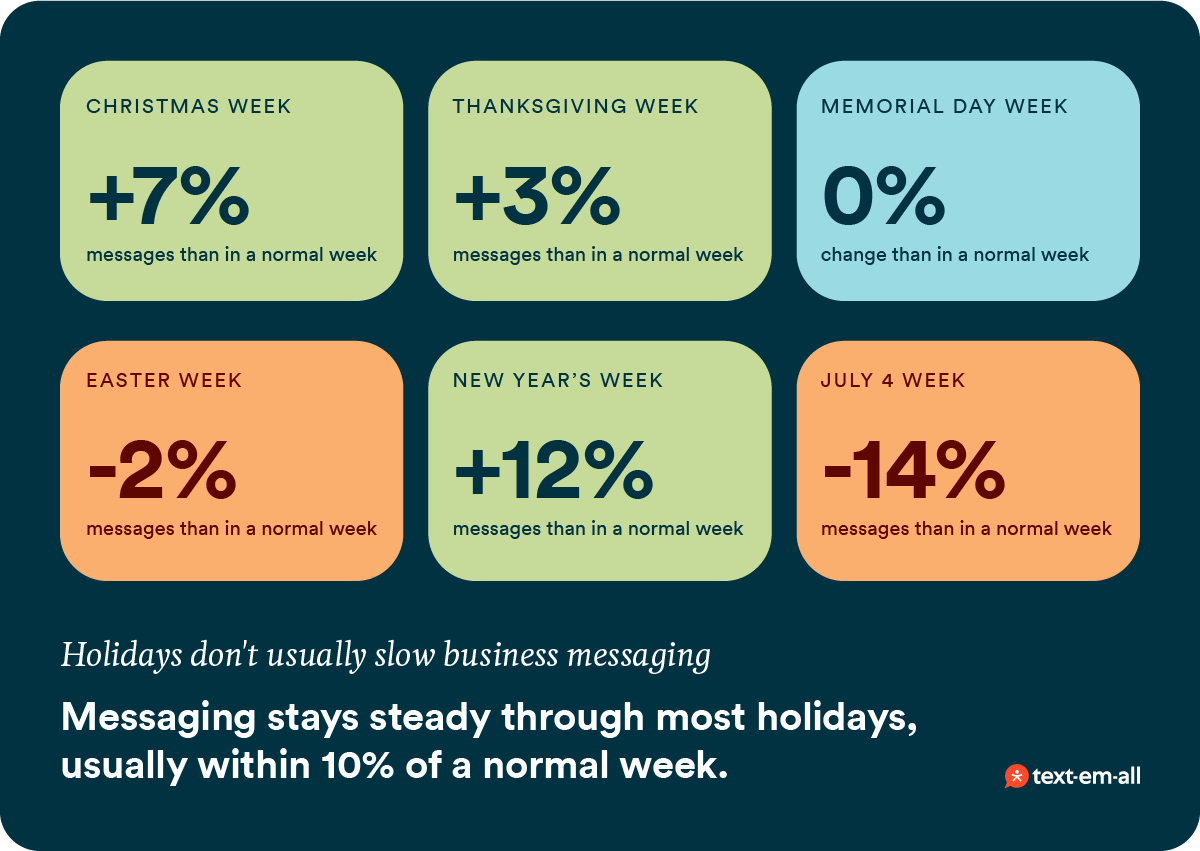
A Text-Em-All infographic showing that business messaging stays steady through most holidays, usually within 10% of a normal week. Compared with a normal week, messages rise 12% in New Year’s week, 7% in Christmas week, and 3% in Thanksgiving week, stay the same in Memorial Day week, and drop 2% in Easter week and 14% in July 4 week.

Questions people ask about this data

What period does it cover?

August 2025 through July 2026, with the trends going back four years to August 2021.

How many organizations does it cover?

More than 16,000 organizations.

What counts as a mass text?

A send to 10 or more people. When this page says "under 100 people," it means sends to 10 through 99 people. One-to-one texts are a separate product, so they're not in any rate, share, or trend here.

What counts as a promotional text?

A text about a sale, an offer, a ticketed event, or product news. Every other text is informational.

Does anybody read the messages?

Software reads each text to label what kind it is, and that's the only time anyone looks at message content. No message, recipient, or customer name appears in any number we publish.

How many people reply to these texts?

About 1 person in 100 replies to a text sent to 100 or more people, and about 4 in 100 to a text sent to under 100 people. At least one person replies to 57% of texts sent to 100 or more people. Most of these messages never asked for a reply: a closure notice is done when somebody reads it.

What do I need to include if I use this information?

You're welcome to quote these numbers. Just credit Text-Em-All and link back to this page. You can cite it as: Text-Em-All, The State of Messaging, 2026. Based on messages sent by more than 16,000 organizations between August 2025 and July 2026. https://www.text-em-all.com/state-of-operational-messaging

The figures in every table and chart on this page are also available as a CSV file.

Which messages does each number cover?

Everything covers texts sent to 10 or more people and automated calls placed through Text-Em-All, August 2025 to July 2026, with trends back to the year to July 2022. This is broadcast-style business messaging, not every text a business sends. By section:

  • Texts and calls: texts as a share of all messages, counting each text recipient and each voice call placed, years to July 2022 to 2026.
  • Message size: texts sent to 10 or more people, years to July 2022 to 2026. The opt-out bars show the share of texts that got at least one opt-out, year to July 2026.
  • Promotional texts: texts sent to 100 or more people, opt-outs per 1,000 people texted, year to July 2026.
  • Opt-outs by year and by kind: texts sent to 100 or more people, the share that got at least one opt-out.
  • Replies: texts sent to 10 or more people, counting replies that arrive within 48 hours of the send.
  • Phone calls: automated calls placed. A small share of calls recorded no outcome and are left out.
  • Seasons: texts sent to 10 or more people. The monthly peaks were tested without each kind's biggest senders.
  • Holidays: all messages (texts to 10 or more people and automated calls), by week. A normal week is the median week. The week of Martin Luther King Jr. Day was also the first storm week.
  • The January storm: closure and emergency text broadcasts per day, January 12 to February 2, 2026, against the median day of the year to July 2026. A weather message is one whose text mentions the weather, sent January 19 to 26, 2026.
How we measured this

Everything comes from Text-Em-All's own records for the twelve months from August 1, 2025 to July 31, 2026, and the same twelve months in each of the four years before. Trends compare complete August-to-July years. Where a trend could rest on a few large senders, we removed the biggest ones and kept the trend only if it held. The holiday-week comparison is the exception: it measures total messaging, with every sender included.

For the first "yes" on an open shift, we counted replies that said the word "yes," left out replies that were opting out, and read the matches by hand to remove false ones.

Reply and opt-out figures cover texts only, because automated calls don't record either one. We count a reply if it arrives within 48 hours of the send. Rates cover sends to 10 or more people, because most of what gets sent anywhere is one person texting one person. Where a figure covers only sends to 100 or more people, the page says so.

Software reads each text and labels it informational or promotional, and by kind, and we check the labels. A small share of calls recorded no outcome, so they're not in the call percentages. Where a figure describes a peak month, we checked that no single organization caused it, and a couple of categories failed, so they're left out. Message length counts the text itself, and 64% is a floor because a message with an emoji splits at 70 characters.

Everything here is a total across thousands of organizations. No customer, message, phone number, or person appears in it.

See how your own sends compare

Set up a free account, load your list, and see who got your message.